A Networking Icebreaker
I was recently asked to provide a short verbal presentation to kick-off a meeting of a networking group. The request was for something interesting to help start a good discussion. What better topic than ‘How are you using your data? Some quick tips to help you start analyzing your data.’ I figured that I could not only share the insight that night but also in a quick post so that everyone could benefit.

‘Data, data everywhere and not a drop of meaning!’ So that’s a bit of a cheesy parody of the famous line from “The Rime of the Ancient Mariner,” but I think it makes a good point. Today we are surrounded by data. It’s on our phones, in our computers, gathered by every company we buy from and even details how many steps we took today.
“Image credit for inner iPhone image to NASA”
Data Advancements
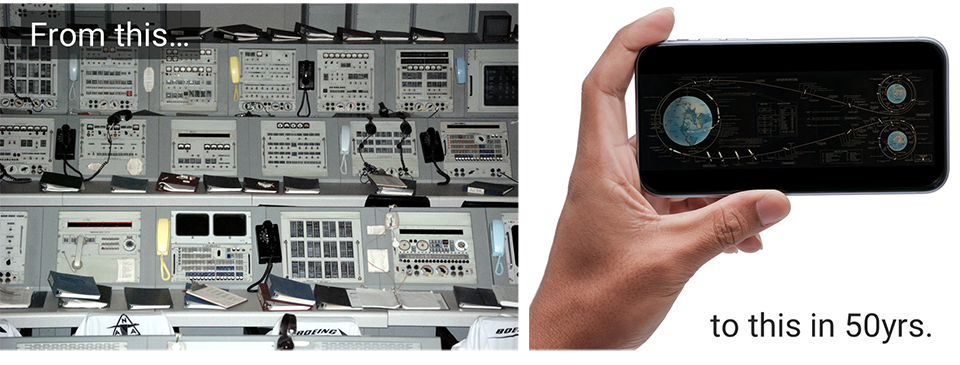
From Mission Control to iPhone
The Apollo Guidance Computer had just 72KB of memory to store data. A smartphone with 512GB of storage space, which is rapidly becoming the norm, has more than seven million times more memory than that guidance computer.
The last issue of the Encyclopedia Britannica was published in 2010. It was 32 volumes, weighed roughly 130 pounds and would require approximately 1GB of hard disk space to store the data in it. That’s a mere 0.0077GB per pound vs a 512GB iPhone 11Pro weighing in at 6.63oz and storing a whopping 1,235.6GB per pound.
So enough of the geeky data facts. I’m sure you’re asking “What does this mean to me, how can I use my data?” Well here are a few ideas of how a small business or solopreneur could use their data to help improve their business and get ahead:
- LinkedIn Data – Like me you probably spend many hours a week networking with others to meet and connect with people of a like mind. Most of us connect with each one of these people on LinkedIn as soon as we can. You may not realize, but you can export this data easily from LinkedIn into a spreadsheet. At this point you can plot trends in your connections, compare it to sales lead introductions and even figure out the best months you had for meeting people.
- Logistics Data – Many small product businesses need to ship their final product to their distributors, stores or customers. This data can be a goldmine of information to support which carrier is best for which circumstances. Who is on time most? How is location a factor? How does cost relate to their service? Would a cheaper but slower carrier save you money? How can I optimize my loading to minimize costs? The questions you could pose are endless.
- Web Analytics – In today’s world if you’re in business, then you have a website. Once you get your website manager to add a tag (a line of HTML code) generated by google to your website, then you have access to Google’s Analytics tool. With this free online tool you can see who visits you when. How long they stay. How many convert into a lead? Do they find you organically or usually from the LinkedIn articles you post? This is key information for you to be able to determine what is the return on investment for your website and marketing campaigns. All this and you don’t even have to open Excel or Sheets.
- Predictive Fleet Analytics – I couldn’t talk about analyzing data without mentioning what we do at Freya. This is a great example of where you can take your data and work in partnership with an analytics company to get not just insights but predictions from your data. We take data gathered on large equipment (aircraft, trains, ships, production machines and more) and then build a model and information dashboard based upon it. A continuous feed of your data can identify when in the future your equipment is going to fail and why. Our customers can continue to explore these results to get this insight well into the future.
Data Insights
How Do You Get Started?
- Identify What You Want to Learn From Your Data – I advocate doing this as early as you can. Though it doesn’t have to be the first step, doing a little brainstorming on what you aim to learn from your data can help mitigate any bias introduced by what data you have. It also keeps you on track to meet your goals and prevents what I call ‘fishing for insight.’ This is where you take your data and look for something interesting. You’re bound to find something, but it’s not much good if it doesn’t help you.
- Collect Your Data – This seems straight forward, but following this step can bring some insight. Before going too far, brainstorm; what data do you have, where it is stored, in what format, how often it is updated, is it clean or does it need some correction? Following this, identify a good repository for it, such as your server, Dropbox, a database etc. Next, collect it and setup schedules or automated mechanisms to keep collecting it.
- Browse Your Data – This is often overlooked but spending your time reviewing what you have can bring rewards. You may be able to identify missing elements that would add great connections between different data sets. Just becoming familiar with it will help with subsequent steps and will certainly improve your discussion with a data expert if you decide to engage one.
- Process Your Data – This is where you work with what you have to get to what you want to learn. This could mean calculating sales averages, visualizing it by geography or aggregating it by month so you can plot a trend. If you have a small data set, start by learning how to use a pivot table in Excel, it’s a quick way to get started.
- Engage an Expert – Sometimes you may need an expert to help you get to the answers you need. Data scientists can certainly provide more complex analysis and modeling techniques. We always start with a quick analysis and a conversation on the ‘art of the possible.’ This outlines what can be done now, in the future and identifying what additional data might need to be collected to get the desired results.
Here are some initial questions you may want to ask yourself to get started or as a different conversation starter at your next networking event:
- “What are you doing with your data today and what could you do better?”
- “What is the one thing you’d like to learn from your data this month?”
- “Where is your data today? Your phone, computer, server, cloud, watch, filing cabinet, your head…”
Data Science is becoming a key element of business operation and for good reason. Many corporations are adding a Chief Data Officer to the executive. This is because they have recognized the advantages that can be gained by regularly thinking about the data you have and how it can be used to improve your decision making. You can also add a ‘How I use my data’ brainstorm to your regular schedule of activities.

If you need an expert to help you, contact us today and we’ll outline the ‘art of the possible’ for your data.