
Towards the end of 2021, Freya hosted a hackathon that split the team into two separate factions asked to solve a distinct set of computer vision problems. The resulting days allowed for collaboration and problem solving that really got the data science juices flowing.
Two Real-World Problems
Each team had a unique task however both centered around detecting visual anomalies
1. Video Anomaly Detection
Key Goal: Identify anomalies in video data to flag for human review.
Problem Description: The customer has a fixed video camera in a port. They have had issues with human reviewers identifying potential security issues in real-time. They have tasked us with creating an algorithm to identify anomalies in the data so that it can be reviewed by a human.
Task: Create a prototype algorithm and software application to analyze the video data and notify human users that it requires further review.
2. Video Data Scoring
Key Goal: Score video data to optimize material usage
Problem Description: The customer has a fixed camera on an industrial mixing process. They need a mechanism to automatically score the mixing 0-10 so that their process can be analyzed in an application and eventually automated.
Task: Create a prototype algorithm and software application to score the production process based on the video data and allow a human user to understand system performance.
The first order of business was to allocate roles: project manager, data science team, dev team, etc. Both teams immediately broke down the problem into finite steps.
Team 1 understood that the solution demanded they grade the provided video to find any sign of anomalies in a mostly uneventful set of videos. They realized the problem required anomaly detection, specifically frame by frame. At first, extracting the average RGB of the port footage while omitting the average white of each frame was discussed. The team agreed that they should process a preset image for a baseline in the algorithm. Similar to the second team, team 1 split into two; while the data science team formulated how to grade and identify these scores in the dashboard, the software team would start building a UI and assist in the overall framework.
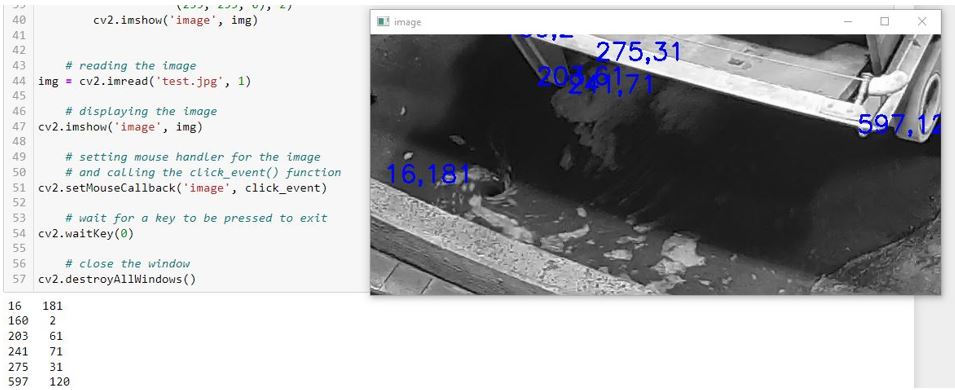
Team 2’s solution demanded they grade the provided industrial mixing video and alert the user of any score outliers, either small or big. While some people processed the video, others would begin outlining the software. From the outset, the team realized they only needed a small section of the video to analyze the machine’s output, so an app was used to single out sections of the frame. After starting to lay out the framework in React, the team started to implement the open cv and data collection process.
Both teams benefited from doling out responsibilities and oversight early on, allowing members to work on their strong suits. Both teams also broke the problem down into incremental parts and leaned on their prior knowledge to gain an advantage, with some team members recalling how they had applied computer vision in online video games. With two days to come up with a solution, each team had limited time to work with.
The Solutions
Team 1. Anomaly Detection for Port Security
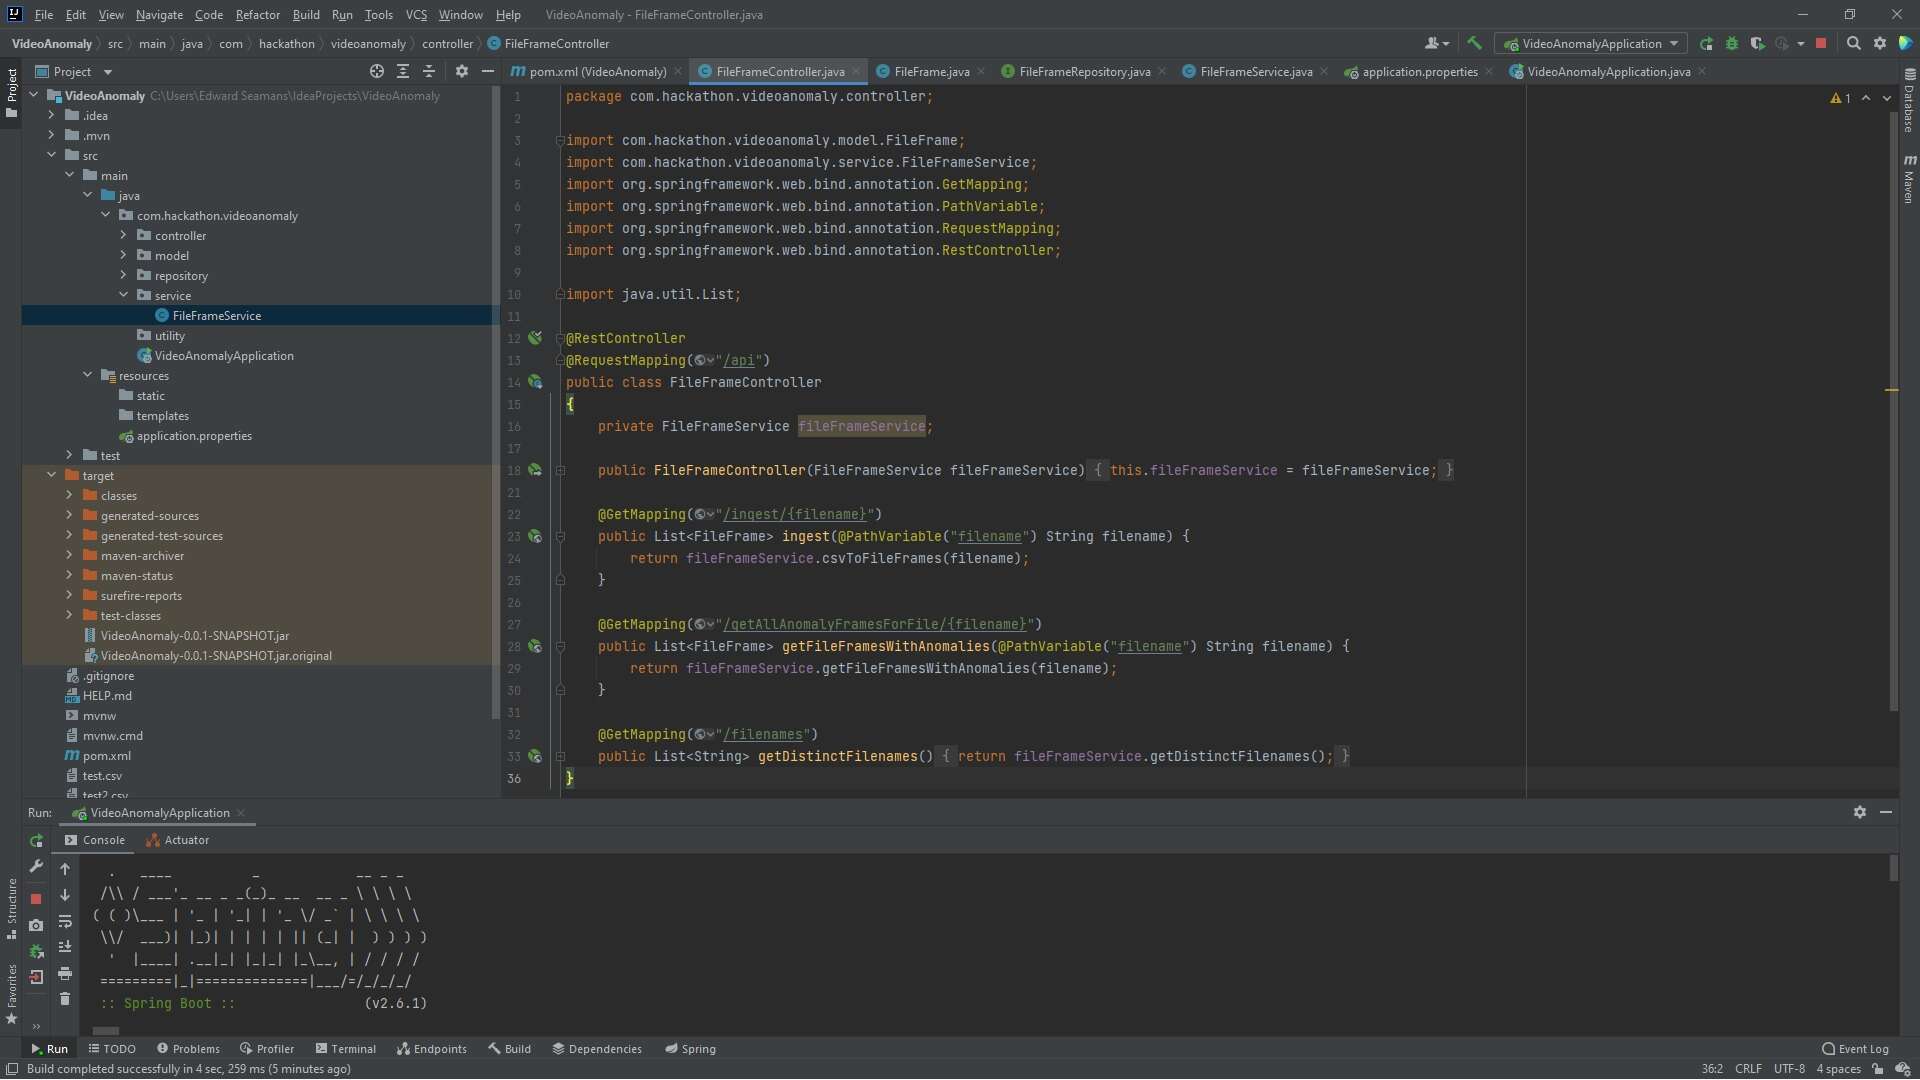
The team was able to develop a proof-of-concept algorithm that accurately detected anomalies in the video. They used Python and OpenCV, primarily focusing on background estimation and background subtraction to process the video. For the backend work, Springboot and Postgres DB were used to ingest a CSV file that resulted from video processing. The data was then loaded to the backend server which provided endpoints (seen below) for the next phase, the UI.
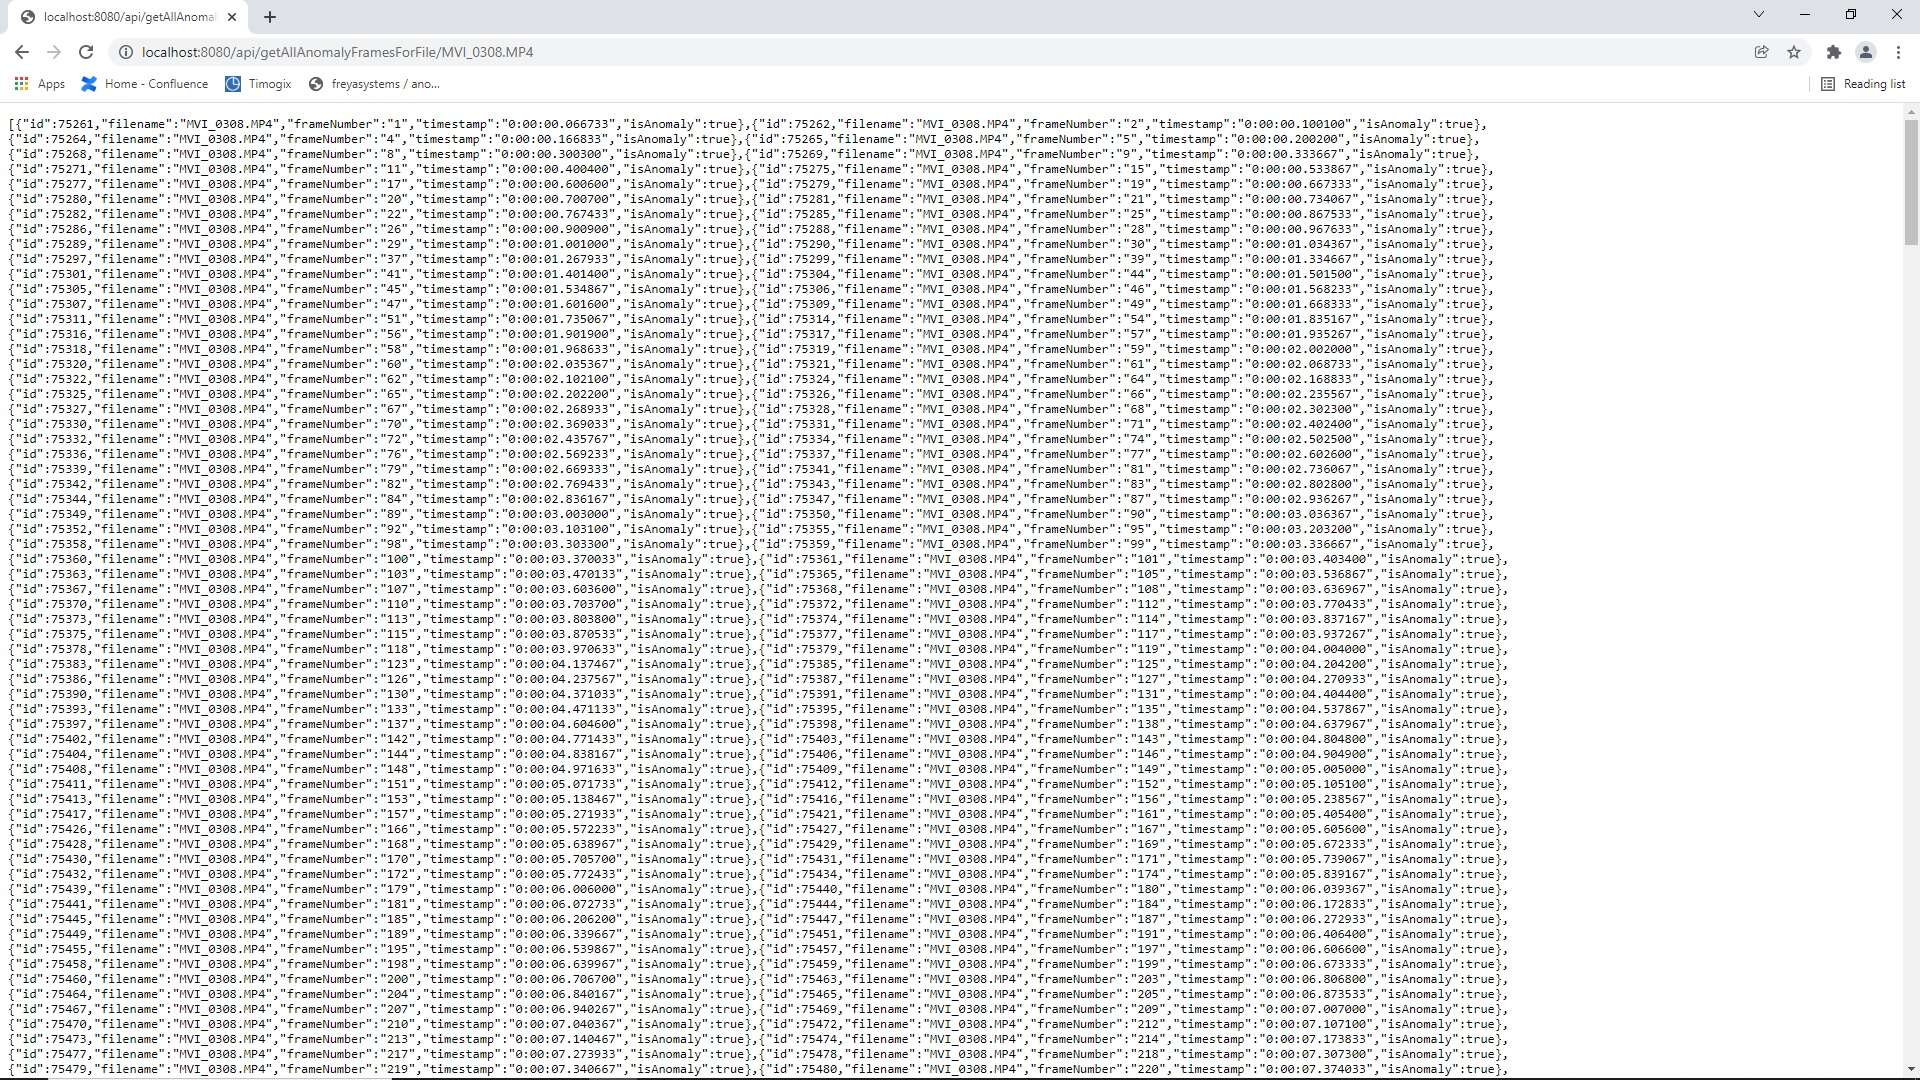
The UI utilized React front end and took endpoints from back-end provided data in a JSON array, displaying data in a table.
An expansion of this proof of concept would see snapshots of the anomaly with highlighted areas of detection. In addition, a way to classify anomalies with defined labels would be incorporated.
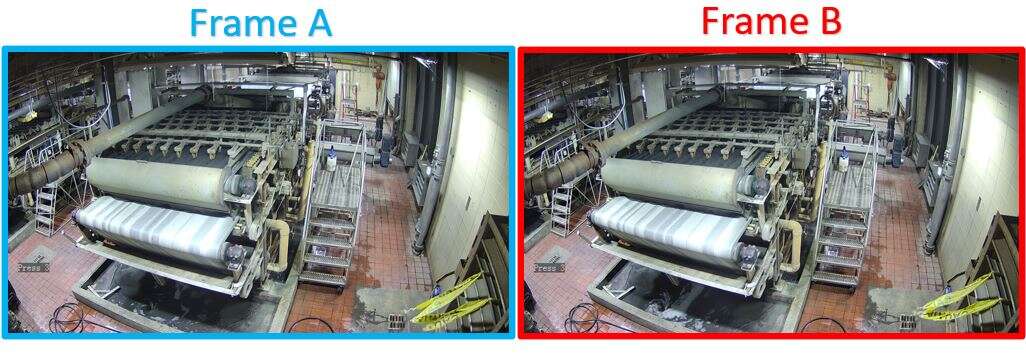
Team 2. Industrial Water-Flow Video Scoring
The team needed to score the content makeup of industrial wastewater (light vs dark liquid) through video footage from an industrial building. The following are the steps they took to develop an algorithm that could score the wastewater outflow.
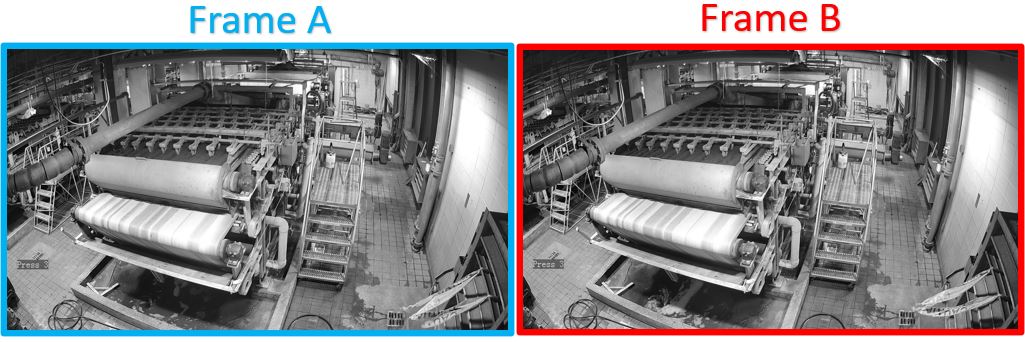
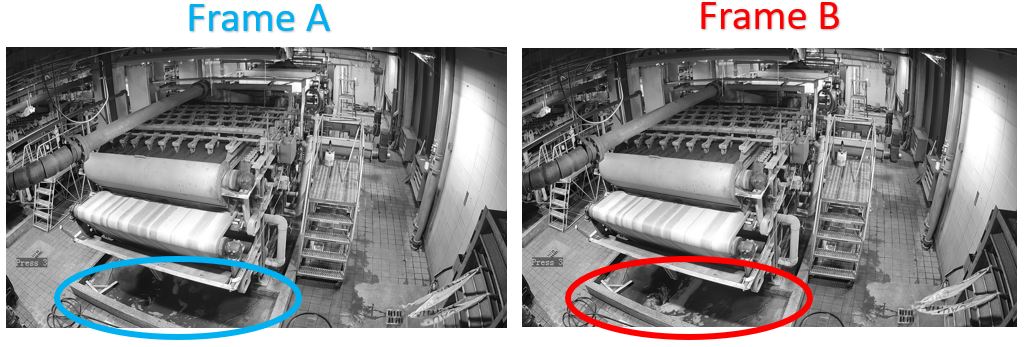
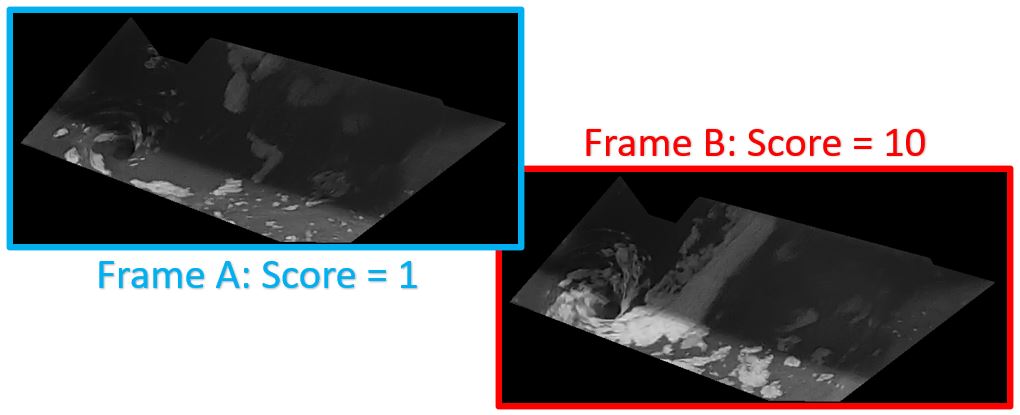
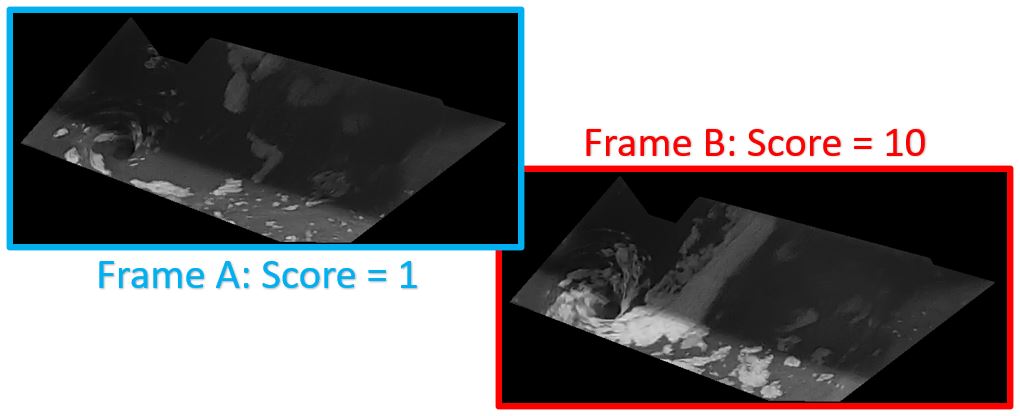
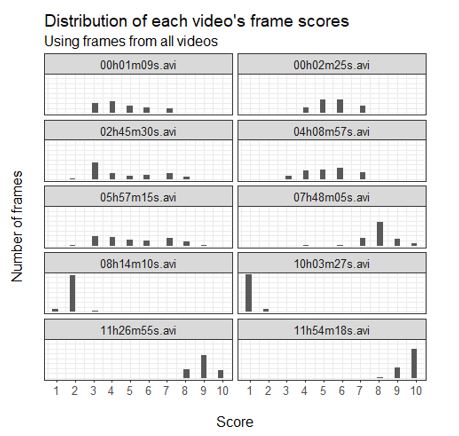
Each frame was then scored using a scoring algorithm which would:
- Sum the grayscale pixel values for each frame
- Compute deciles of sums across all frames
- Assign a 1-10 score to each frame via the corresponding decile
From the input industrial mixing videos, the algorithm was able to rate the amount of light vs dark substance in the run-off wastewater. The team was able to create a distribution of each video’s frame scores.
Extending this proof of concept would include producing a real-time dashboard, setting up alerts to notify when the score is too high or low, adding additional interactivity to data visualizations, automating polymer adjustments based on an algorithm, storing historical data, and enabling historic footage viewing.