NEED
Five year prediction of aircraft availability based upon provided operating tempo.
The Background
Our customer, a manufacturer of military rotary aircraft, had an urgent need for a forecast of mission capability rates for a particular block (a sub-fleet) of aircraft. Mission capability defines the current condition of an aircraft providing an indication to fleet managers of its ability to perform assigned missions (search and rescue, personnel transport, cargo transport, training etc).
After an initial consultation we established the problem outline and the required format of the output. Once this was completed, we rapidly initiated a detailed analysis. The results would give executives confidence to support their decision making and allow them to make assertions relating to fleet improvements within the program. These improvements would be focused on arresting a decline in fleet readiness.
The Question
“Could we predict the availability of aircraft assuming the current maintenance policy and operating tempo up to 5 years into the future?”
APPROACH
Data science led model development. Followed by UX driven application development.
The Approach
This project lent itself well to a standard data analytics approach: data collection and review, exploration, modeling, model testing and results presentation.
In this case a large amount of work was needed to reformat the data as it had not yet been cleaned and imported into a database. We were able to fill in many of the missing attributes that were required in order to perform the analysis based on a strong understanding of the platform data and in partnership with the OEM subject matter experts.
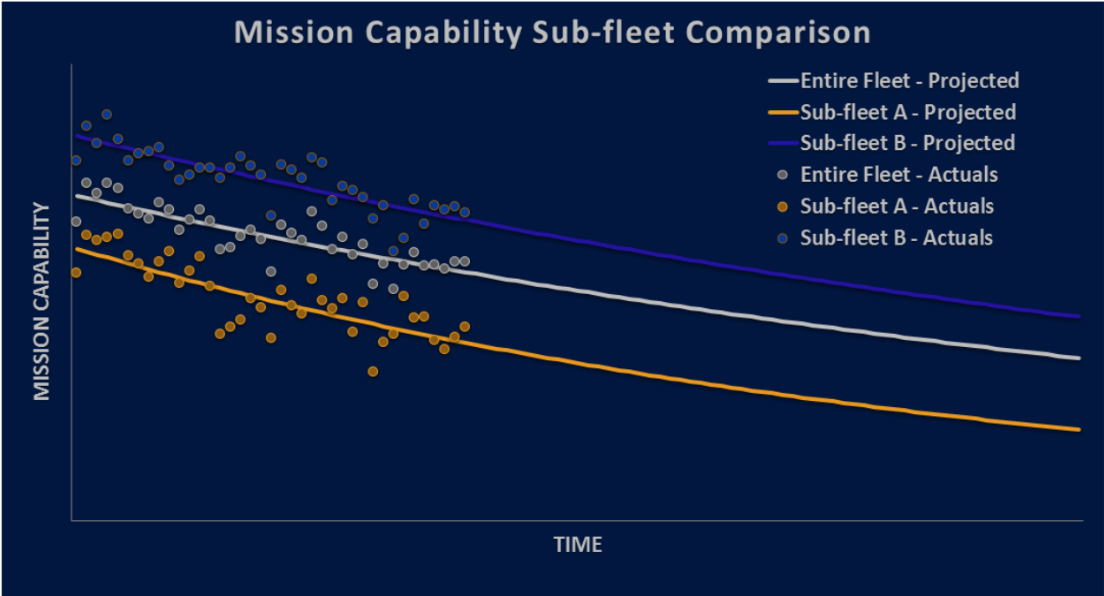
Using some data aggregation, we quickly established an average mission capability by block. We considered adding standard deviations to show the potential range of forecasted values but knew from previous experience that it would inhibit understanding for the target audience so we decided against it. A plot of the data revealed a negative trend for both blocks of aircraft under study.
When exploring the data, both linear and exponential models performed better in different circumstances. The exponential model was selected because it made sense from a theoretical perspective. The model contains an asymptote which allows the prediction to stabilize around a positive, non-zero value as opposed to the linear model which extends to infinity. It also provided better results with our test dataset and its associated performance metrics. We were able to test our model by running it against historic data and comparing our predictions with known outcomes.
Using this historic data, our model was only 3%-4% off actuals on average. This allowed our customer to feel confident in the forecast and support their position with the end user.
RESULTS
A configurable dashboard showing key information to decision makers.
The Result
As required by the customer we were able to develop a five-year forecast of the fleet mission capability including projections for each block of aircraft. In addition, further analysis indicated a significant recent drop off in availability. The trend deviation was especially important as it provided evidence of a persistent deterioration of availability within the fleet. We recommended additional analysis to investigate the significant loss in mission capability, with the aim of providing key insights that would allow a solution to be developed to increase the performance of the platform.
These results were delivered first in an interactive report that included comments and additional details on the findings including: current performance, future projections, and quality of the forecast from the previous year. We furthermore applied our knowledge of state-of-the-art analytical tools and thus we were able to deliver a customized configurable dashboard that visually presented the key information to decision makers.


