How to create Tabsets in R Markdown
The Goal: Space Saving Displays for Similar Figures in an HTML Report R Markdown is a fantastic tool for R users seeking to combine data visualization and analysis in a single reproducible deliverable. However, there are instances in which the volume of figures required clogs up the report, which acts as a nuisance at best […]
How to create a tabset using Quarto & R
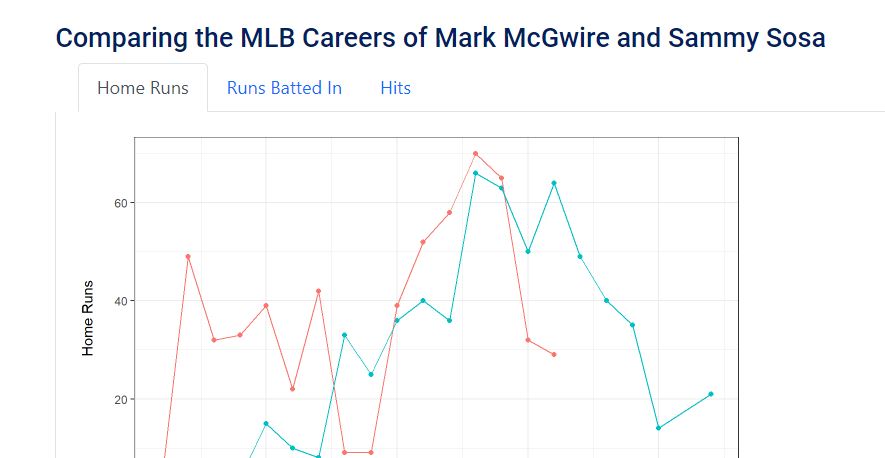
Learn which technologies combine to make data a critical organizational asset Read our tutorial below on space-efficient displays of multiple figures in HTML reports using Quarto and R. What is Quarto? Quarto is a new open source scientific and technical publishing system created by Posit (formerly RStudio). Quarto is marketed as a next generation version […]
How to Create Dynamic Tabs in R Markdown
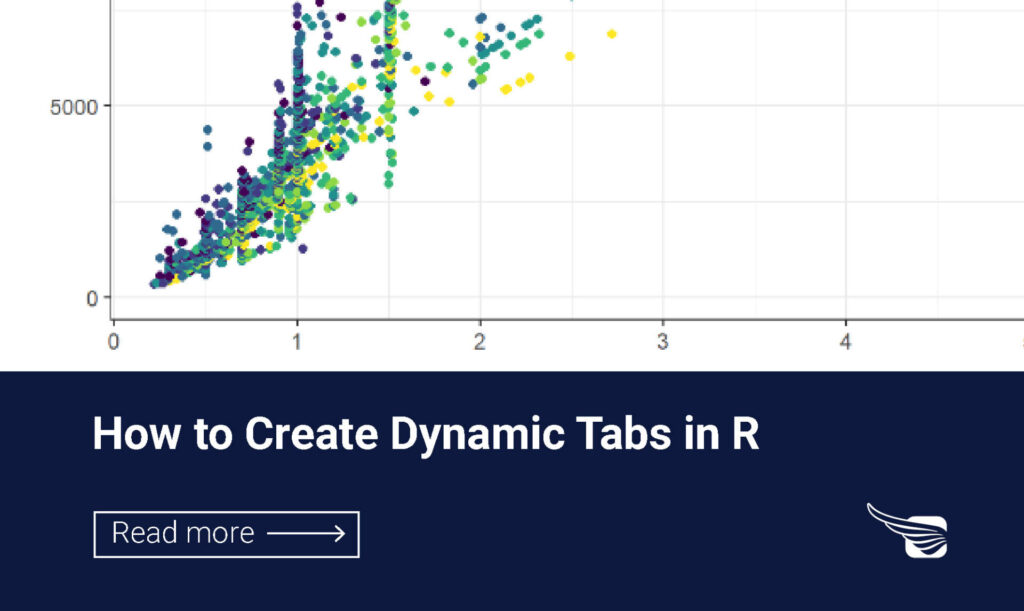
How to Create Dynamic Tabs in R Markdown Tutorial on programmatically generating tab headings for multiple figures in HTML reports Freya Systems Extension of Previous Tabsets Tutorial A previous tutorial, “How to use tabsets in R Markdown”, introduced tabsets for grouping figures together into an interactive instance. In an R markdown notebook, users can […]